Melnikov Dmitry, Harris Andrew, Volynets Anna, Belousov Alexander, Belousova Marina Dynamic of the lava flows during the Tolbachik Fissure eruption in 2012-2013 (Kamchatka) inferred from the satellite and ground-based observations // EGU General Assembly 2014. 2014, Vienna, Austria. 2014.
Аннотация
Fissure eruption on the slope of Plosky Tolbachik volcano continued from November 27th, 2012 until September
2013. It was named as The Institute of Volcanology and Seismology 50th Anniversary Fissure Tolbachik Eruption.
The eruption started from the 5 km-long fissure opening and continued with the intensive lava effusion from it.
During the first two days of eruption the length of the lava flows was 9 km, and lava covered the area of 14.4
km2 (Gordeev et al., 2013). Lava discharge rate at this period was about 400 m3/sec. Two eruptive centers were
formed on the fissure – upper (Menyailov vent) and lower (Naboko vent), and lava gushed from them to the height
up to 200-300 meters. On December 1st, the Menyailov vent activity ceased, and the eruption concentrated at the
Naboko vent. Cinder cone was formed here, and lava flows effused from the base of the cone. Lava erupted from
the Menyailov vent, is different from the Naboko vent lava by higher silica content (SiO2 55.35 wt.% vs. 52.5
wt.%, respectively). That may be caused by the discharge of two levels of the magma chamber, fractionated to
a different extent. Morphologically, lava flows from the beginning of eruption until April 2013 were dominantly
aa-lava type, and from April until September 2013 pahoehoe type dominated.
For distinguishing of the dynamic of the lava flows the following methods were applied. As remote sensing methods
we used different satellite data – for specification of the area covered by lava flows, their length, temperature we
used Landsat 7 ETM+, Landsat 8, ASTER, EO-1 ALI and HYPERION. For time averaged discharge rate (TADR)
and lava flow area determination we used AVHRR data. We detected that in December 2013 lava discharge rate
varied from 120 to 40 m3/sec, and then it gradually decreased to average values 5-15 m3/sec and remained on this
level until the end of eruption. These data are confirmed by the ground-based observations, which were conducted
during the entire period of eruption. At the end of eruption in September 2013, lava flows area was about 36 km2, the maximum length of the lava flow – 15 km.
Neal C.A., Herrick J.A., Girina O.A., Chibisova M.V., Rybin A.V., McGimsey R.G., Dixon J. 2010 Volcanic activity in Alaska, Kamchatka, and the Kurile Islands: Summary of events and response of the Alaska Volcano Observatory. 2014. 76 p.
Аннотация
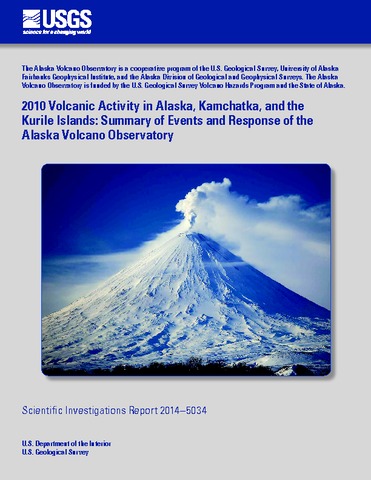
The Alaska Volcano Observatory (AVO) responded to eruptions, possible eruptions, volcanic unrest or suspected unrest at 12 volcanic centers in Alaska during 2010. The most notable volcanic activity consisted of intermittent ash emissions from long-active Cleveland volcano in the Aleutian Islands. AVO staff also participated in hazard communication regarding eruptions or unrest at seven volcanoes in Russia as part of an ongoing collaborative role in the Kamchatka and Sakhalin Volcanic Eruption Response Teams.
Paris Raphaël, Switzer Adam D., Belousova Marina, Belousov Alexander, Ontowirjo Budianto, Whelley Patrick L., Ulvrova Martina Volcanic tsunami: a review of source mechanisms, past events and hazards in Southeast Asia (Indonesia, Philippines, Papua New Guinea) // Natural Hazards. 2014. Vol. 70. № 1. P. 447-470. doi:10.1007/s11069-013-0822-8.
Rowell Colin R., Fee David, Szuberla Curt A.L., Arnoult Ken, Matoza Robin S., Firstov Pavel P., Kim Keehoon, Makhmudov Evgeniy Three-dimensional volcano-acoustic source localization at Karymsky Volcano, Kamchatka, Russia // Journal of Volcanology and Geothermal Research. 2014. Vol. 283. P. 101 - 115. doi: 10.1016/j.jvolgeores.2014.06.015.
Аннотация
Abstract We test two methods of 3-D acoustic source localization on volcanic explosions and small-scale jetting events at Karymsky Volcano, Kamchatka, Russia. Recent infrasound studies have provided evidence that volcanic jets produce low-frequency aerodynamic sound (jet noise) similar to that from man-made jet engines. For man-made jet noise, noise sources localize along the turbulent jet flow downstream of the nozzle. Discrimination of jet noise sources along the axis of a volcanic jet requires high resolution in the vertical dimension, which is very difficult to achieve with typical volcano-acoustic network geometries. At Karymsky Volcano, an eroded edifice (Dvor Caldera) adjacent to the active cone provided a platform for the deployment of five infrasound sensors in July 2012 with intra-network relief of ~ 600 m. The network was designed to target large-scale jetting, but unfortunately only small-scale jetting and explosions were recorded during the 12-day experiment. A novel 3-D inverse localization method, srcLoc, is tested and compared against a more common grid-search semblance technique. Simulations using synthetic signals show that srcLoc is capable of determining vertical solutions to within ± 150 m or better (for signal-to-noise ratios ≥ 1) for this network configuration. However, srcLoc locations for explosions and small-scale jetting at Karymsky Volcano show a persistent overestimation of source elevation and underestimation of sound speed. The semblance method provides more realistic source locations, likely because it uses a fixed, realistic sound speed of ~ 340 m/s. Explosion waveforms exhibit amplitude relationships and waveform distortion strikingly similar to those theorized by modeling studies of wave diffraction around the crater rim. We suggest that the delay of acoustic signals and apparent elevated source locations are due to raypaths altered by topography and/or crater diffraction effects, implying that topography in the vent region must be accounted for when attempting 3-D volcano acoustic source localization. Though the data presented here are insufficient to resolve small-scale jet noise sources, similar techniques may be successfully applied to large volcanic jets in the future.
Shellnutt J. Gregory, Belousov Alexander, Belousova Marina, Wang Kuo-Lung, Zellmer Georg F. Generation of calc-alkaline andesite of the Tatun volcanic group (Taiwan) within an extensional environment by crystal fractionation // International Geology Review. 2014. Vol. 56. № 9. P. 1156-1171. doi:10.1080/00206814.2014.921865.
Simon A., Yogodzinski G.M., Robertson K., Smith E., Selyangin O., Kiryukhin A., Mulcahy S.R., Walker J.D. Evolution and genesis of volcanic rocks from Mutnovsky Volcano, Kamchatka // Journal of Volcanology and Geothermal Research. 2014. Vol. 286. P. 116 - 137. doi: 10.1016/j.jvolgeores.2014.09.003.
Аннотация
This study presents new geochemical data for Mutnovsky Volcano, located on the volcanic front of the southern portion of the Kamchatka arc. Field relationships show that Mutnovsky Volcano is comprised of four distinct stratocones, which have grown over that past 80 ka. The youngest center, Mutnovsky IV, has produced basalts and basaltic andesites only. The three older centers (Mutnovsky I, II, III) are dominated by basalt and basaltic andesite (60–80 by volume), but each has also produced small volumes of andesite and dacite. Across centers of all ages, Mutnovsky lavas define a tholeiitic igneous series, from 48–70 SiO2. Basalts and basaltic andesites have relatively low K2O and Na2O, and high FeO* and Al2O3 compared to volcanic rocks throughout Kamchatka. The mafic lavas are also depleted in the light rare earth elements (REEs), with chondrite-normalized La/Sm < 1.0. Andesites have generally higher REE abundances and are more enriched in light REEs, some showing negative Eu anomalies. All samples are depleted in field strength elements (HFSEs) relative to similarly incompatible REEs (e.g., low La/Ta, Nd/Hf compared to MORB), similar to island arc volcanic rocks worldwide. Radiogenic isotope ratios (Sr, Nd, Pb, Hf) are similar for samples from all four eruptive centers, and indicate that all samples were produced by melting of a similar source mixture. No clear age-progressive changes are evident in the compositions of Mutnovsky lavas. Mass balance and assimilation-fractional crystallization (AFC) modeling of major and rare earth elements (REEs) indicate that basaltic andesites were produced by FC of plagioclase, clinopyroxene and olivine from a parental basalt, combined with assimilation of a melt composition similar to dacite lavas present at Mutnovsky. This modeling also indicates that andesites were produced by FC of plagioclase from basaltic andesite, combined with assimilation of dacite. Dacites erupted from Mutnovsky I and II have low abundances of REEs, and do not appear to be related to mafic magmas by FC or AFC processes. These dacites are modeled as the products of dehydration partial melting at mid-crustal levels of a garnet-free, amphibole-bearing basaltic rock, which itself formed in the mid-crust by emplacement of magma that originated from the same source as all Mutnovsky magmas. Lead isotope data indicate that subducted sediment is likely present in the source beneath Mutnovsky and most Kamchatka volcanoes, but uniformly radiogenic Hf and Nd in mafic samples (εNd = 8.7–9.3, εHf = 15.4–15.9), and significant variation in trace element ratios at nearly constant εNd and εHf, indicate that sediment plays a minor roll in controlling subduction trace element patterns in Mutnovsky lavas. Mafic lavas with Ba/Th > 450 require an aqueous fluid source component from subducting oceanic crust, but mixing patterns in isotope versus trace element ratio plots for Hf and the REEs (εNd and εHf vs. ratios with Ce, Nd and Hf) demonstrate that a source component with radiogenic Nd and Hf, and fractionated (arc-type) trace element ratios must be present in the source of Mutnovsky lavas. This source component, which is interpreted to be a partial melt of subducted basalt in the eclogite facies (eclogite melt source component), appears to be present in the source of all Kamchatka volcanoes. Cross-arc geochemical patterns at Mutnovsky and in other arc systems (Isu-Bonin, Tonga-Kermadec) suggest that the aqueous fluid component diminishes and the eclogite melt component is increased from volcanoes at the arc front compared to those in rear-arc positions.
Sorokin A.A., Korolev S.P., Romanova I.M., Girina O.A., Urmanov I.P. RESTful Web Service for Kamchatka Volcanoes Observations // Modern Information Technologies in Earth Sciences. Proceedings of the International Conference. September 8-13, 2014, Petropavlovsk-Kamchatsky. Vladivostok: Dalnauka. 2014. P. 155
Volynets Anna, Melnikov Dmitry, Griboedova Irina Plagioclase lapilli and phenocrysts in the lavas of the 2012-2013 Tolbachik Fissure eruption // 8-th Biennial Workshop on Japan-Kamchatka-Alaska Subduction Processes, JKASP 2014. 22-26 September, 2014, Sapporo, Japan. 2014.
Аннотация
The 2012-2013 Tolbachik Fissure eruption started from lava gushing and effusion in the Menyailov vent on November 27 th , 2012; after three days the activity of this vent ceased and the eruption continued from the Naboko vent until its end in September 2013. The eruption produced about 0.7 km 3 of high-Al basaltic trachyandesites (Dvigalo et al., 2014). At Menyailov vent SiO2 concentrations were as high as 55.35 wt.% and K2O -2.67 wt.% -higher than in any previously erupted rocks in Tolbachik monogenetic area. From the beginning of December, SiO 2 concentration in lavas dropped by 2 wt.% and remained at this level until the end of eruption. MgO, TiO2, Mg# increased, K2O, Na2O decreased slightly. Most prominent change we observe in K2O/MgO ratio, which was about 0.7 in the Menyailov vent rocks and became 0.5 in the Naboko vent rocks. Details of the geochemical composition of the volcanic rocks produced by this eruption are reported elsewhere (Volynets et al., 2013, Volynets et al., 2014 a, b); here we present the results of the geochemical study of the main phenocrysts in the lavas – plagioclase. For the detailed geochemical study of the plagioclase we selected two samples from the Naboko vent (Pl-phyric lavas, erupted in February and August) and five crystal lapilli (two of them were erupted in December 2012, and three – during 2013, when the new cone has been already built). Plagioclases in these lavas are represented by two generations of labradorite and bytownite. Pl phenocrysts of the 1 st generation are large (up to 2 cm on the long axis) strongly resorbed at the edges and sometimes in the cores as well, containing lots of glass inclusions. Pl subphenocrysts of the 2 nd generation are smaller (less than 500 µm), usually nonresorbed and clean, having euhedral facets. Normal, reversed and patchy zoning are typical for all studied crystals (fig.1, I and II). Maximum concentrations of An (up to 83% at compositional variation between An50 and 74) has been measured in the patchy zones. Crystal lapilli are characterized by the oscillatory zoning with An fluctuations around An57-63 (fig. 1, III and IV). This kind of zoning is the result of the diffusion control of Pl growth at low growth rates (Sibley et al., 1976). The edges of lapilli are usually rich of glassy inclusions, tunnel-like dissolution structures, Ol, Px, Mt inclusions (fig. 1, III and IV). There are abundant resorption zones in lapilli, with plenty of glassy inclusions. These zones are characterized by the patchy zoning with An concentration jumps up to An74; usually these high-An areas are observed near the inclusions of glass. At the edges of lapilli there are zones with An gradual decrease towards the rim from An 74 to An61.
Plagioclase lapilli and phenocrysts in the lavas of the 2012-2013 Tolbachik Fissure eruption.