Malik N.A. A decade (2013-2023) of direct sampling from high-temperature fumaroles at Avacha Volcano, Kamchatka: Gas geochemistry, seasonal and long-term variations // Journal of Volcanology and Geothermal Research. 2024. Vol. 455. P. 108179. https://doi.org/10.1016/j.jvolgeores.2024.108179
Аннотация
The 1991 eruption of Avacha volcano resulted in a lava plug inside its crater, making high-temperature fumaroles available for sampling. At present, there are two high-temperature fumarolic fields: the Eastern (up to 665 ◦ C) and the Western (up to 840 ◦ C), both associated with a fissure in the lava plug caused by a weak 2001 explosion. The paper presents chemical and isotopic compositions (H-O-C-S) of the directly sampled fumaroles over the period 2013 – 2023, mainly from the Eastern field. We revealed seasonal variations of water isotopic composition and concentrations of some components of the gas. High-temperature gases from Avacha volcano are characterized by chemical and isotopic compositions typical for volcanoes in subduction zones, but with a slightly increased content of H2O, a reduced content of HCl. A relatively high concentration of methane is noted in the gases of low-temperature field. Methane in high-temperature gas with δ13C(CH4) = 16.8 ‰ has abiogenic origin. For high-temperature gases, their redox state (H2/H2O and CO/CO2) is controlled mainly by the sulfur gas buffer (H2S/SO2); methane is not chemically equilibrated. The molar ratio C/S ~ 1 is typical for volcanoes in the Kuril-Kamchatka Arc. The measured fumarolic temperatures at the Eastern field are descending over time from 626 ◦ C in 2013 to 410 ◦ C in 2023. The apparent equilibrium temperatures calculated for reactions that include CO, CO2, H2, H2O, H2S and SO2 are generally higher than the measured temperatures and do not show the descending trend. However, calculated equilibrium temperatures for the H2O-CO-CO2-CH4 system are very close to the measured temperatures. Two periods of the increased seismic activity which occurred from 2013 to 2023, in November 2014 – January 2015 and October – December 2019, correlated with changes in the morphology and gas flow rates at the Western fumarolic field.
Manevich A.G., Girina O.A., Melnikov D.V., Nuzhdaev A.A. 2016-2017 explosive eruptions of Kamchatka volcanoes based on KVERT data // JKASP-2018. Petropavlovsk-Kamchatsky: IVS FEB RAS. 2018.
Manevich A.G., Girina O.A., Melnikov D.V., Nuzhdaev A.A., Romanova I.M., Loupian E.A., Sorokin A.A., Kramareva L.S., Korolev S.P., Uvarov I.A. The Evolution of the 300 years of the RAS lava dome of the Sheveluch volcano (Kamchatka) in 2024-2025 // Journal of Volcanology and Seismology. 2025. Vol. 19. № S1. P. S63-S71. https://doi.org/10.1134/S0742046325700563
Аннотация
The Sheveluch volcano is the northernmost active volcano in Kamchatka. In this work, we describe the activity of the new 300 Years of the RAS lava dome of volcano in 2024–2025. Explosive eruptions of the dome were observed on August 17–18, September 1–2, and November 7–10, 2024: eruptive columns rose up to 9, 8, and 11 km above sea level, respectively, and ash plumes were extended for 2400, 1100, and 3000 km to the east and northeast of the volcano. The results of detailed real-time monitoring of the volcanic eruption are presented using a video surveillance system and various satellite data from The Remote Monitoring of Volcanic Activity in Kamchatka and the Kurile Islands information system (VolSatView, http://kamchatka.volcanoes.smislab.ru).
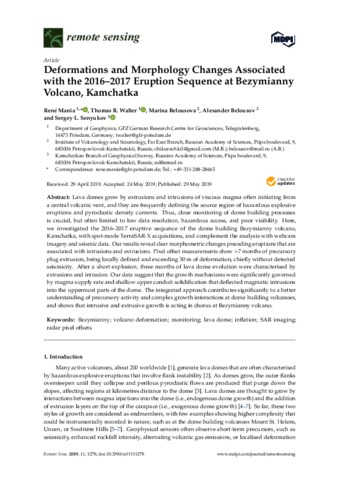
Mania Rene, Walter Thomas, Belousova Marina, Belousov Alexander, Senyukov Sergey Deformations and Morphology Changes Associated with the 2016–2017 Eruption Sequence at Bezymianny Volcano, Kamchatka // Remote Sensing. 2019. № 11. P. 1278. https://doi.org/10.3390/rs11111278
Marchenko A. G., Volfson A. A., Morozov M. V., Khrol N. S., Steinberg G. S., Steinberg M. G. Geochemical Characteristics of Volcanogenic Deposits and Exhalation Mineralization in the Crater Part of the Active Kudryavy Volcano (Iturup Island of the Kuril Arc) // Geology of Ore Deposits. 2020. Vol. 62. № 2. P. 122-137. doi:10.1134/S1075701520020038
Аннотация
Exhalation ore mineralization is developing in the crater part of the active Kudryavy volcano. Lithogeochemical sampling results have revealed that Re, Au, Ag, As, Bi, Cd, Cu, Ge, In, Mo, Pb, S, Sb, Se, Sn, Te, Tl, W, Zn, Rb, and Cs accumulate in solid fumarole formations. These elements are transported by high-temperature volcanic gases and are deposited in mineral phases in the near-surface horizons of fumarole fields under decreasing temperature conditions. The contents of rhenium and other metals in volcanic deposits of fumarole fields locally reach values characteristic of ore deposits. Zoning of lithogeochemical anomalies in ore element associations has been revealed, expressed by the series Re, Mo, W, Au, Cu, Ag, Zn, Cs, Ge → In → Bi, Cd, Pb, Sn, Tl → As, Sb, Se, Te, (Cu, Ag, Au) in the direction from the highest-temperature fumarole fields to less hot, reflecting their temperature zoning. It is demonstrated that lateral geochemical zoning is caused both by the ore element contents in fumarole gases, which depend on temperature, and by differences in the optimal temperature ranges in which various elements precipitate from gases. Signatures for similar exhalation mineral formation processes have been revealed that occurred in the recent geological past at the neighboring extinct Sredny volcano. This suggests the occurrence of similar processes within other volcanic systems of Iturup Island, which increases the prospects for detecting complex exhalation-related manifestations of rare, base, and noble metals.
Marhinin E.K., Stratula D.S. Relationship between chemical composition of volcanic rocks and depth of the seismofocal layer as shown by the Kliuchevskaya volcanic Grup (Kamchatka) and the Kurile-Kamchatka Island arc // Bulletin Volcanologique. 1973. Vol. 37. Vol. 2. P. 175-182. 8 p. doi:10.1007/BF02597129